Referential and Reviewed International Scientific-Analytical Journal of Ivane Javakhishvili Tbilisi State University, Faculty of Economics and Business


Shenzhen s Special Economic Zon (SEZ) – Lessons for Azerbaijan
https://doi.org/10.52340/eab.2024.16.01.05
The main purpose of this article is to find out the role of Shenzhen SEZ importance in the Chinese economy. The article explores the reason behind the Chinese economic boom starting from 1980’s. Starting from that period, China has become one of the leading players in the global economy due to Shenzhen immense success. Capital going to the Shenzhen SEZ played essential part for Chinese economy. The article highlights Shenzhen's exceptional success attributed to its strategic location and size. The regression analysis conducted from 1980 to 2019 reveals a strong positive correlation between the number of enterprises in Shenzhen and the capital utilized from Hong Kong and Macao.
The article extends its analysis to Azerbaijan, showcasing the country's efforts in establishing Special Economic Zones for economic development. It sheds light on the challenges faced by Azerbaijan, such as economic constraints limiting the expansion of industrial parks. The conclusion recommends attracting foreign investors as operators or developers to share costs and benefits, promoting sustainable development.
Keywords: Shenzhen, Azerbaijan, SEZ, finance, investment, tax
JEL Codes: F41, F42, H54, R42
Introduction
China is one of the leading players in the global economy. It has diversified economy with sustainable financial situation. Before the 1980’s, China was one of the agricultural producers in the world and even now Chinese citizens claims that they are still farmers. They didn’t really interact with the foreign countries. However, after 1978, “Open door policy” enacted by the Chinese committee (Peking Review, 1978). Chen, Chang and Zhang (2022, p 691), Wei (1995, p. 74) and Deci (1996, p. 529) stated that this policy was necessary both in economic and political way since neighbor countries were developing both in economical (Japan and Korea) and military (Soviet Union) way (Chen, Chang & Zhang, 2022). Morrison (2013, p. 7) claimed that in order to country must achieve economic growth, they have to accomplish 2 main factors: large-scale capital investment and rapid productivity growth. China had high productivity in the different sector through sheer amount of population and hardworking etiquette. Thanks to Open Door Policy, China has attracted western capital
to the country. Right now, China has the highest output both in industrial and agricultural products.
The mastermind behind of this miracle growth and sustainable economy was the Deng Xiaoping (Ayuso, 2020). Unlike his predecessors Deng always supported the idea of integrated western system and Chinese communist system. He is the inventor of "Reform and Opening up of China" policy which it reversed China from closed country to an open country (Tisdell, 2009 p. 271). It aims to invites foreign capital to the China in order to create manufactory and production in China. However, doing that was costly and as a newly developing nation, state has to bear a much risk. In order to eliminate this problem and achieve its targets, Deng reformed the structure of business environment in China. So, starting from 1980, First 4 major Special Economic Zones created in China (Yeung, Lee & Kee, 2009, p. 223). Thanks to initial success of these zones, more SEZ emerged from the China. Right now, China has different types of SEZ such as Free Trade Zones (FTZ’s), Industrial Parks, Export Processing Zones (EPZ), bonded areas, Technology parks, agricultural parks and so forth.
Shenzhen SEZ
Shenzhen SEZ was more successful than the other SEZ due to its size and perfect location. Shenzhen located in the mouth of Pearl river delta and total size of this SEZ is 327.6 square kilometers which contains sixth the size of Shenzhen municipality (Yeh, 1985, p. 154). Thus, gave Shenzhen perfect advantage to grow quickly than other SEZ. For instance, in 1979, total Foreign Direct Investment (FDI) net flow in China was 80 thousand USD while in 1980 it was 57 million USD. In addition, in 1981, these 4 SEZ attracted 59.8 percent of total Foreign Direct Investment (FDI) in China and Shenzhen alone had 50.6 percent of this percentage (Yuan et.al., 2010). Other 3 SEZ contributed other 9.2 percent. (Wong, 1987). Because of Deng direct order, Chinese government created these SEZ in Southern China. Deng wanted to ensure capital inflow will inflow to these zones especially to the Shenzhen. In addition, China couldn’t bear these initial capital costs since it was pilot project for government and newly developed businesses simply couldn’t afford it. However, foreign investors had capital to expand their businesses. Many of these capital owners are situated in Hong Kong and Macao. Investment from Hong-Kong and Macao rose quickly through years.
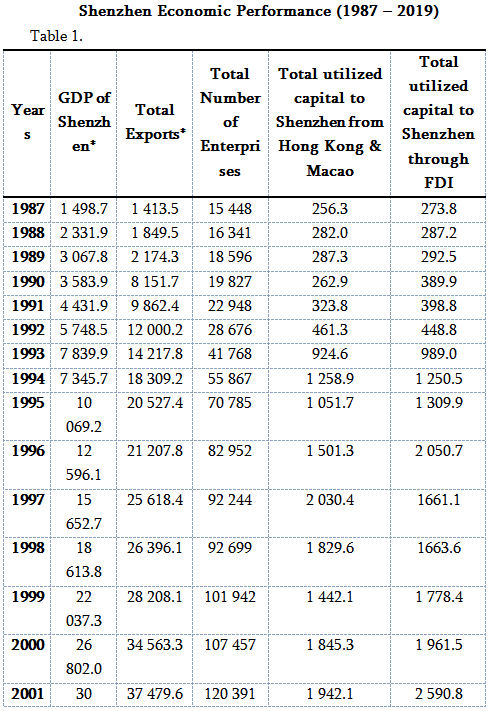
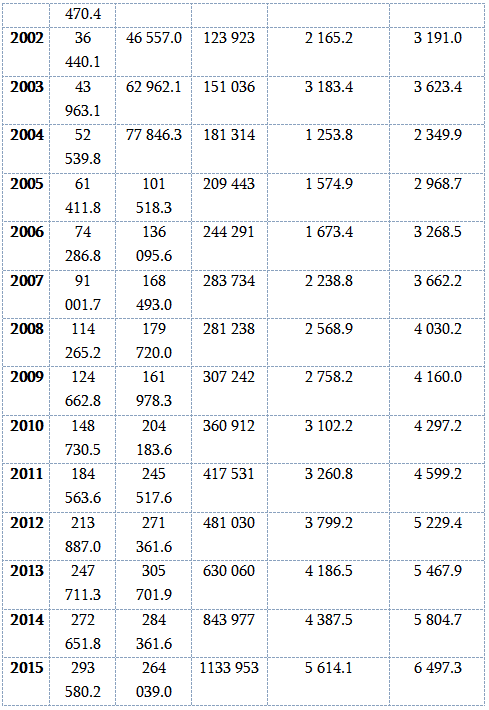
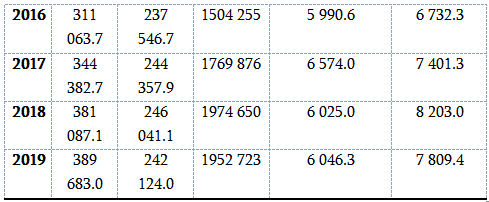
* Data converted to USD based on average IMF exchange rate between RMB and USD and shown in million USD
Source: Shenzhen Statistical Yearbook 2020 & Student’s own research
Table 1. shows that Shenzhen SEZ played important part in the region as well as the economy of China. In 1980, 332.9 thousand people lived in Shenzhen. After 10 years it changed dramatically. Population of Shenzhen rose to more than 2 million people. In addition, table shows the Shenzhen’s main capital investment comes from the Hong Kong & Macao. Especially the Hong Kong, since it played significant part and considered one of the biggest financial centers in the Asia. This is also a concerning problem since the main source of investment comes from tiny piece of land located in Asia.
Regression Analysis
Study covers the period of 1980 to 2019. In order to find connection between Hong Kong, Shenzhen and Chinese economy, we must create regression model based on the China and Shenzhen SEZ information. This information would be sufficient enough to create our regression model.
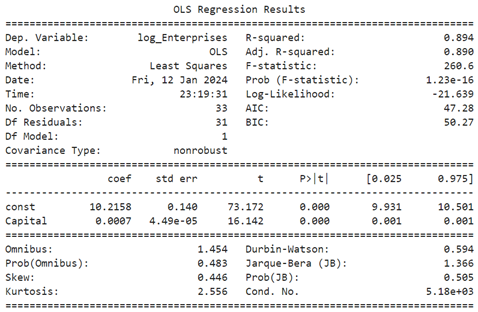
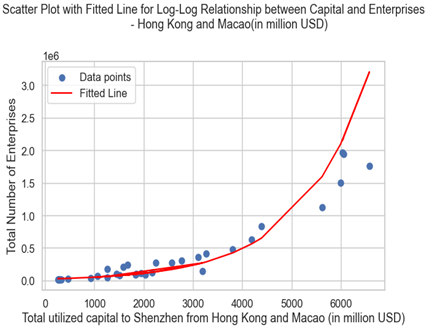
In the first Table and Graph, we analyze the relationship between enterprises that operate in Shenzhen and total capital utilized from Hong Kong and Macao between 1987-2019:
Source: Author’s own research.
In this table, the coefficient for log (Capital), 0.0007, represents the elasticity. A 1% increase in Capital is associated with 0.07% increase in the number of enterprises, assuming other factors remain constant. This shows us the overall idea that the number of enterprises facilitate in Shenzhen has moderate level correlation with the total utilized capital from Hong Kong and Macao. In addition, there is R statistics in the table as well. R-squared number means that there is strong relationship between dependent variable and independent variable. It means the R-squared value of 0.894 indicates that the model explains 89.4% of the variance in the log-transformed number of enterprises. The F-statistic is also significant (p < 0.05), suggesting that the overall model is statistically significant. Thus, shows the relationship between enterprises that operate in Shenzhen has strong positive correlation with capital utilized from Hong Kong and Macao.
Hong-Kong also plays dominant role in the investments on other parts of China as well. In 2021, Hong Kong based investment had a record 76% (88 billion USD dollar) of all “foreign capital that actually utilized” in China (Bloomberg, 2022). China also relies on Hong-Kong sustainable free market and stable economy (Ho, 2018, p. 7). However, radical legislations accepted by current Chinese government degraded the free market environment within Hong-Kong. This pushes many foreign investors to leave Hong-Kong. As a result, FDI will decrease in time. According to State Administration of Foreign Exchange in China (safe.gov.cn, 2023), China FDI inflow amounted negative 11.8 billion USD (statista.com, 2023) in the third quarter of 2023.
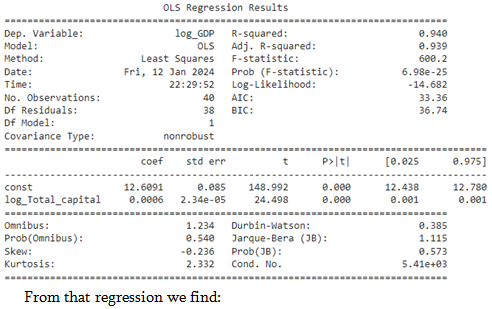
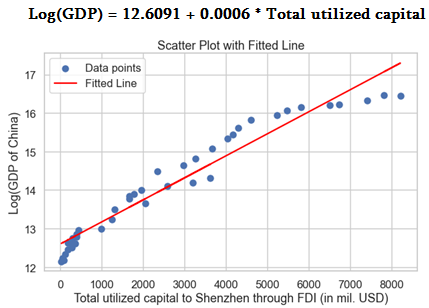
Second table shows the regression results between GDP of China and utilized capital through FDI in Shenzhen between 1980-2019:
Source: Author’s own research.
The intercept, 12.6091, represents the estimated log (GDP) when Total Utilized Capital is zero. Exponentiating the intercept gives the estimated GDP when Total Utilized Capital is 1:
Baseline GDP = exp (12.6091)
Elasticity: The coefficient for Total Utilized Capital, 0.0006, represents the elasticity. A 1 million dollar increase in Total Utilized Capital is associated with a 0.06 % increase in GDP, assuming other factors remain constant.
These regression analysis’s show us that Shenzhen SEZ plays significant part in the Chinese economy and Hong Kong role in the development of Shenzhen SEZ.
Azerbaijani SEZ
Azerbaijan is one of the developing countries located in Southern Caucasus region. For the development purposes, Azerbaijan also created Special Economic Zones which has significant impact on national economy. Azerbaijan currently has 1 Free Economic Zone (is under construction), 7 Industrial park (2 is under construction) and 5 Industrial estate (1 is under construction). Main purpose of Industrial estates is to encourage small-medium enterprises investment to these territories. However, they don’t have any exemption or discount on tax officially. Instead, they are getting "investment promotion paper". According the tax code of Azerbaijan, this paper gives the owner 50% reduction on profit or income taxes for the 7 years. In addition, it exempt residents from property and land taxes for the 7 years. Furthermore, residents could get concessional loan from the government. Thus, would boost the resident’s financial capability to produce and even invest more. However, Industrial parks are more beneficial and also their main target to attract big corporations and producers into their territory. In order to do that they have been created in the big empty territories where they could expand easily.
Between 2016-2021 the governing structure of these industrial parks was "Sumgait Chemical-Industrial Park" LLC collects duties, rents and service from the residents. This company get its first revenue in 2016 and that revenue was 0.39 million AZN. However, in 2021 revenue was 18.57 million AZN and expense were 18.15 million AZN. Total profit was 59 thousand. This is a serious warning, because this LLC was in loss till 2021. Profit from 2021 wasn’t promising. In order to prevent these subsequent losses and make standard strategy on these zones, President Ilham Aliyev created Economic Zones Development Agency in 2018. The sole purpose of this agency is to govern, control and develop Industrial Parks and Estates. After 2021, LLC removed, and agency took over all Industrial parks.
Sumgait Chemical-Industrial Park is one of the leading industrial parks in Azerbaijan. Total area of this park is 583.5 hectare and it is biggest Industrial park in the Azerbaijan. Furthermore, Sumgait Chemical-Industrial Park is a top tier Industrial park based on every indicator. Graph below shows the yearly performance of Sumgait Chemical-Industrial Park between 2018-2022:
Sumgait Chemical-Industrial Park Economic Performance (2018 – 2022)
Table 2.
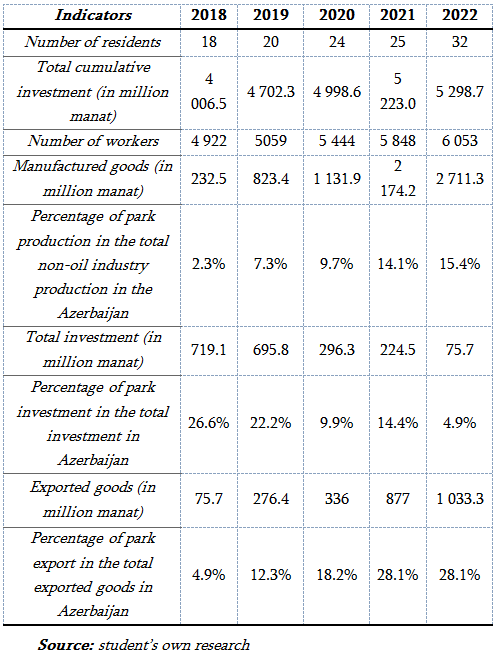
As we can see, development in the Sumgait Chemical-Industrial park is boosting national economy. When the government created this zone in 2014, the initial territory was 295.62 hectare. Due to the increasing demand for this zone government further expanded this territory to 583.5 hectare. The initial investment by the government was 171.33 million manat. This capital invested only 295.62 hectare, and this capital only covered administration building and infrastructure expense. After first phase of development, government created "Sumgait Chemical-Industrial Park" LLC where it has direct control of this zone. This LLC also owned by government. In 2015, 2016 and 2017 another 3 parks were established by the government. These parks are Qaradagh Industrial Park, Pirallahi Industrial Park and Mingachevir Industrial Park. Currently, Qaradagh and Mingachevir Industrial parks have only 1 resident. Main reason is that government created these zones not for attracting investments but to secure the survival of existing firms in that region. Qaradagh Industrial park resident is "Baku Shipyard" LLC which is considered biggest ship manufacturer in the Caspian Sea. Investment cost of this project was 470 million USD. In Mingachevir Industrial park, "Mingachevir Textile" LLC operates as sole resident. This fabric also considered the biggest textile fabric in the Caucasus region. As we can see, industrial parks serve as a booster project for the existing firms. In 2022, total cumulative investment to these zones were overall 6.4 billion AZN and 5.3 billion AZN were invested only in Sumgait Chemical-Industrial parks. Furthermore, these 5 parks produced worth 2.8 billion AZN and Sumgait Chemical-Industrial Park produced 2.7 billion AZN worth product.
As we stated above, government establishes and funds these zones. However, lack of investment staggers the SEZ development. For example, in 2015 oil crisis hit the Azerbaijan economy and government couldn’t expand Sumgait Chemical-Industrial park. There is also liberated territories occupied by Armenia in 1990’s and government must bear the development cost of these region which predicted cost more than 30 billion manat. So, government have to limit economic investment to the other projects.
Right now, the best option for future SEZ of Azerbaijani economy is to attract foreign investors not as the residents but also an operator or developer who shares cost and benefits of SEZ with the Azerbaijan. In addition, the tax-custom incentives of SEZ supports operating company to draw friendly firms to these zones. Right now, Azerbaijan is creating their first Free Economic Zones in Alat. This zone is more advantageous than industrial parks. For example, residents are free from Sales, Profit/Revenue and other corporate taxes. Furthermore, they are developing basic and super infrastructure in this zone in order to provide storage and supportive services on the production. Government couldn’t bare this cost as they are busy to repairing Qarabagh region, they are using private method where developer company develops SEZ while government bears infrastructure and road costs. After the establishment developer leases their areas and buildings to resident companies.
Conclusion and Recommendations
The evolution of China's economy from a primarily agrarian nation to a global economic powerhouse has been nothing short of remarkable. The implementation of the "Open Door Policy" in 1978, coupled with Deng Xiaoping's visionary "Reform and Opening up of China" policy, marked a turning point that invited foreign capital and transformed China into an open and diversified economy. Special Economic Zones (SEZs) played a pivotal role in this transformation, with Shenzhen SEZ standing out as a beacon of success.
Shenzhen's success can be attributed to its strategic location, expansive size, and the direct orders of Deng Xiaoping, who aimed to ensure capital inflow to the Southern China region. The creation of SEZs, including Free Trade Zones, Industrial Parks, and Export Processing Zones, became instrumental in attracting foreign investments, catalyzing rapid economic growth.
However, concerns arise as the majority of capital investment in Shenzhen, particularly from financial centers like Hong Kong, raises questions about over-dependence on a specific source. The article's regression analysis highlights a strong positive correlation between the number of enterprises in Shenzhen and capital utilized from Hong Kong and Macao. This interconnectedness underscores the need for China to diversify its sources of capital to mitigate risks associated with relying heavily on a singular region.
Azerbaijan's strategic establishment of Special Economic Zones (SEZs), including Industrial Parks and Estates, has played a crucial role in the nation's economic development. The Sumgait Chemical-Industrial Park stands out as a notable success, evolving from initial challenges to become the largest industrial park in the country, contributing significantly to the national economy.
The government's initiative to create and fund these zones reflects a commitment to fostering economic growth, attracting both small-medium enterprises and major corporations. The transformation of the governing structure from "Sumgait Chemical-Industrial Park" LLC to the Economic Zones Development Agency in 2018 demonstrates adaptive governance to address challenges and promote standardized strategies.
While industrial parks like Sumgait serve as boosters for existing firms, the government's approach in creating Qaradagh, Pirallahi, and Mingachevir Industrial Parks underscores a strategic move to secure the survival of vital industries in specific regions. These parks have not only attracted investment but have also become key players in their respective sectors, such as the Caspian Sea's largest ship manufacturer and the biggest textile fabric in the Caucasus region.
However, the article highlights challenges faced by the government, such as the impact of the 2015 oil crisis and the financial burden of developing liberated territories occupied by Armenia. These challenges have constrained the expansion of SEZs, emphasizing the need for alternative strategies.
Looking forward, the article suggests attracting foreign investors as operators or developers, sharing costs and benefits with Azerbaijan. The establishment of Free Economic Zones in Alat represents a progressive step, offering residents significant tax incentives and fostering private-sector involvement in infrastructure development. This innovative approach, where developers bear infrastructure costs, presents a model for sustainable SEZ growth without overburdening the government.
References:
• Yeung Yue & Lee Joanna & Kee Gordon. (2009). China's Special Economic Zones. Eurasian Geography and Economics – EURASIAN GEOGR ECON. 50. 222-240. 10.2747/1539-7216.50.2.222.
• Zeng D. Z. (2012). Terms and Definitions. In China’s Special Economic Zones and Industrial Clusters: Success and Challenges (p. Page 3-Page 5). Lincoln Institute of Land Policy. http://www.jstor.org/stable/resrep18404.3
• Chou Bill & Ding Xuejie (2015). A Comparative Analysis of Shenzhen and Kashgar in Development as Special Economic Zones. East Asia. 32. 117-136. 10.1007/s12140-015-9235-5.
• Chu David K.Y., Mo Kwan Lee Fong, Kin Che Lam, Yen Tak Ng, See Lou Too, and Kwan Yiu Wong (1982). Shenzhen Special Economic Zone: China’s Experiment in Modernization. Hong Kong: Hong Kong Geographical Association.
• Dirlik A. (2012). The Idea of a ‘Chinese Model’: A Critical Discussion. China Information, 26(3), 277-302.
• Sklair Leslie “Problems of Socialist Development—the Significance of Shenzhen Special Economic Zone for China Open-Door Development Strategy,” International Journal of Urban and Regional Research, 15, 2:197–215, 1991.
• Yeung Y. M., Lee J., & Kee G. (2009). China's Special Economic Zones at 30. Eurasian Geography and Economics, 50(2), 222-240.
• Yeung Yue & Lee, Joanna & Kee Gordon (2009). China's Special Economic Zones. Eurasian Geography and Economics – EURASIAN GEOGR ECON. 50. 222-240. 10.2747/1539-7216.50.2.222.
• Tang Wing-shing (2001). Urban Development and Planning in Shenzhen Special Economic Zone: Elements for an Informed Understanding. Hong Kong: Centre for China Urban and Regional Studies, Hong Kong Baptist University, Occasional Paper No. 2.
• Wong K.-Y. (1987). China’s Special Economic Zone Experiment: An Appraisal. Geografiska Annaler. Series B, Human Geography, 69(1), 27-40. https://doi.org/10.2307/490409
• SBSZ (Statistical Bureau of Shenzhen), Shenzhen Statistical Yearbook 2020. Beijing, China: China Statistics Press, 2020.
• SBSZ (Statistical Bureau of Shenzhen), Shenzhen Statistical Yearbook 2007. Beijing, China: China Statistics Press, 2021.
• SBGD (Statistical Bureau of Guangdong), Guangdong Statistical Yearbook 2020. Beijing, China: China Statistics Press, 2020
• Honglin Zhang Kevin (2005). "Why does so much FDI from Hong Kong and Taiwan go to Mainland China?," China Economic Review, Elsevier, vol. 16(3), pages 293-307.
• UNCTAD (UNITED NATIONS CONFERENCE ON TRADE AND DEVELOPMENT), WORLD INVESTMENT REPORT, SPECIAL ECONOMIC ZONE 2019. Geneva, Switzerland: United Nations, 2019
• Story of cities #25: Shannon – a tiny Irish town inspires China’s economic boom (2016). Theguardian, 19 April, https://www.theguardian.com/cities/2016/apr/19/story-of-cities-25-shannon-ireland-china-economic-boom
• Tisdell C. (2009). Economic Reform and Openness in China: China’s Development Policies in the last 30 years. Economic Analysis and Policy, 39(2), 271-294.
• China’s Foreign Investment Data Distorted by Hong Kong Flows (2022). Bloomberg, 6 September, https://www.bloomberg.com/news/articles/2022-09-05/china-round-tripping-inflates-foreign-direct-investment-data
• Zhang X. and Po Yuk H. (1998), "Determinants of Hong Kong manufacturing Investment in China: a Survey", Marketing Intelligence & Planning, Vol. 16 No. 4, pp. 260-267. https://doi.org/10.1108/02634509810224446
• SMART J. and SMART A. (1991). Personal Relations and Divergent Economies: a Case Study of Hong Kong Investment in South China. International Journal of Urban and Regional Research, 15: 216-233. https://doi.org/10.1111/j.1468-2427.1991.tb00631.x
• National Statistics Bureau. 2021. China Statistical Yearbook. Beijing: China Statistics Press.
• Yuan Y., Guo H., Xu H., Li W., Luo S., Lin H., & Yuan Y. (2010). China’s First Special Economic Zone: The Case of Shenzhen. Building Engines for Growth and Competitiveness in China, 55.
• “Communique of the Third Plenary Session of the Eleventh Central Committee of the Communist Party of China,” Peking Review, No. 52 (Dec. 29, 1978), p. 11. F
• Edmund R Thompson, Clustering of Foreign Direct Investment and Enhanced Technology Transfer: Evidence from Hong Kong Garment Firms in China, World Development, Volume 30, Issue 5, 2002, Pages 873-889, ISSN 0305-750X, https://doi.org/10.1016/S0305-750X(02)00009-8.
• Wong K.-Y. (1987). China’s Special Economic Zone Experiment: An Appraisal. Geografiska Annaler. Series B, Human Geography, 69(1), 27–40. https://doi.org/10.2307/490409
• Dees S. Foreign Direct Investment in China: Determinants and Effects. Economics of Planning 31, 175–194 (1998). https://doi.org/10.1023/A:1003576930461
• Zhang S. (2022). Protection of Foreign Investment in China: The Foreign Investment Law and the Changing Landscape. Eur Bus Org Law Rev 23, 1049–1076 https://doi.org/10.1007/s40804-022-00247-1
• Chen C., Chang L., & Zhang Y. (1995). The Role of Foreign Direct Investment in China's Post-1978 Economic Development. World Development, 23(4), 691-703.
• Yu, Q. (1998). Capital Investment, International Trade and Economic Growth in China: Evidence in the 1980–1990s. China Economic Review, 9(1), 73-84.
https://www.worldshipping.org/top-50-ports
• Deci Z. (1996). The Open Door Policy and Urban Development in China. Habitat International, 20(4), 525-529.
• Wei S. J. (1995). The Open Door Policy and China's Rapid Growth: Evidence from City-Level Data. In Growth Theories in Light of the East Asian Experience (pp. 73-104). University of Chicago Press.
• Morrison W. M. (2013). China's Economic Rise: History, Trends, Challenges and Implications for the United States (pp. 20-22). Washington, DC: Congressional Research Service.
• Ayuso Castillo M. (2020). Political Change from Mao Zedong to Deng Xiaoping.
https://www.safe.gov.cn/en/2023/1103/2145.html
https://www.statista.com/chart/31257/foreign-direct-investment-inflows-to-china-by-quarter/
https://www.bloomberg.com/news/articles/2022-09-05/china-round-tripping-inflates-foreign-direct-investment-data
• Ho C. Y. G. (2018). The Chessboard of Hong Kong and Chinese Politics: The Downfall of “One Country, Two Systems” (Doctoral dissertation, The University of Waikato).
• Pakdeenurit Patcharee & Suthikarnnarunai Nanthi & Rattanawong Wanchai (2014). Special Economic Zone: Facts, Roles, and Opportunities of Investment. Lecture Notes in Engineering and Computer Science. 2210.
• Yeh G.-O. A. (1985). Development of the Special Economic Zone in Shenzhen, The People’s Republic of China. Ekistics, 52(311), 154–161. http://www.jstor.org/stable/43622838