Referential and Reviewed International Scientific-Analytical Journal of Ivane Javakhishvili Tbilisi State University, Faculty of Economics and Business
Price Competitiveness of Georgia as a Tourist Destination During and Post-COVID-19 Pandemic
doi.org/10.52340/eab.2024.16.03.11
This study investigates Georgia's price competitiveness as a tourist destination during and after the COVID-19 pandemic. It compares Georgia with its neighboring countries (Txrkiye, Russian Federation, Azerbaijan, and Armenia) using factors that influence price competitiveness. The analysis uses the World Economic Forum's Travel & Tourism Competitiveness Index (TTCI) variables, focusing on four key indicators: ticket taxes and airport charges, hotel price index, purchasing power parity, and fuel price levels. For the analyses, the study uses ANOVA and IQR statistical tests. The findings show that Georgia, despite efforts, holds an intermediate position compared to its neighbors due to high regional competition. The study emphasizes the need for Georgia to improve service quality instead of just reducing prices to enhance its tourism competitiveness post-pandemic. The proposed methodology can be applied to competing regional countries, as included in WEF statistics. Moreover, the same methods can be used to assess the inter-regional competitive environment.
Keywords: COVID-19, tourism, price, competition, competitiveness, challenges, IQR, ANOVA
JEL Codes: D40, D41, L83
Introduction
In the initial phase of the COVID-19 pandemic, the travel and tourism industry's impacts were globally underestimated compared to other issues (kkare, Soriano, Porada-Rochońc, 2021). In the second year of the pandemic, politicians and private sector representatives lacked crucial information for decision-making (kkare, Soriano, Porada-Rochońc, 2021). Following a strong year in 2023, international tourism is on track to return to pre-pandemic levels in 2024 (UN Tourism, 2024).
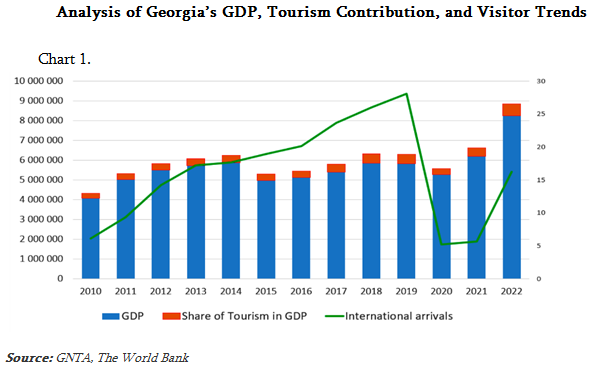
Tourism is becoming increasingly important for Georgia's economy (Khelashvili, 2021). In 2008, tourism's share of Georgia's GDP was only 6.9%, rising to 8.4% in 2019, just before the pandemic. The latest data from the Georgian National Tourism Administration (GNTA, 2022) shows that in 2022, tourism's share of GDP was 7.2% (World Bank; GNTA) (See chart 1). Restoring tourism is crucial for Georgia's post-pandemic competitiveness. In 2019, Georgia received a record 9.3 million foreign visitors, up 7% from 2018 (GNTA, 2022). With the pandemic, foreign visitors dropped to 1.7 million (GNTA, 2022). In 2022, Georgia received 5.4 million visitors, matching numbers from 2013 and 2014 (GNTA, 2022). As international tourism is on track to return to pre-pandemic levels in 2024 (UN Tourism, 2024), Georgia still has a long way to go (see chart 1).
Tourism was one of the most affected industries during the pandemic (Papava, 2020; Abbas et al., 2021). Therefore, determining the latest trends in tourism and studying competitiveness are crucial for the market's future development and recovery.
Lower travel costs in a country enhance its appeal to travelers and investors in the Travel & Tourism sector (TTCI, 2019). Factors influencing price competitiveness include airfare ticket taxes and airport charges, which can increase flight costs; the relative cost of hotel accommodations; the cost of living, measured by purchasing power parity; and fuel prices, which directly affect travel expenses (TTCI, 2019).
This research aims to assess the price competitiveness of Georgia's tourism industry and compare it to neighboring countries in the region.
Conceptual Approach and Research Design
Georgia and its neighbors (Txrkiye, Russian Federation, Azerbaijan, and Armenia) are the focus of this research on tourism competitiveness. Many scholars have extensively investigated tourism competitiveness and the various factors and indicators that significantly influence it. The literature review that was conducted by the author (Okroshidze, Meyer, Khelashvili, 2024) revealed that several authors and organizations consider price a significant indicator of competitiveness, including: Go, Govers (1999); Ritchie, Crouch (2003); Dwyer, Kim (2003); World Economic Forum (2004); Gooroochurn, Sugiyarto (2005).
According to the World Economic Forum's methodology from 2007 to 2019, competition is determined by numerous factors, with ~price~ being fundamental. The competitive environment is assessed using fourteen generalized pillars (TTCI, 2019). This research selects the Price Competitiveness pillar with its four indicators for analysis.
Over the years, the World Economic Forum (WEF) has made slight modifications to the list of indicators in its reports, although the overall methodology has largely remained consistent. Following 2019, the WEF published two reports in 2021 and 2024 under the name Travel & Tourism Development Index, representing an evolution of the Travel & Tourism Competitiveness Index, which this study analyzes (Travel & Tourism Competitiveness Index 2021, 2024). Due to the absence of detailed country-specific data, including information on each pillar and indicator for each country, our study does not incorporate data from the newer reports (Travel & Tourism Competitiveness Index 2021, 2024). But we tried to fill the gaps in the information from 2020 to 2024 from available resources (National Bank of Georgia; TBC Capital; Statista Market Insights; PMCG; Ycharts etc.). Instead, the study considers latest available relevant and/or related data from alternate sources.
Given the importance of price competitiveness, this study analyzes the competition in the region based on the indicators provided in the Price Competitiveness pillar of the Travel & Tourism Competitiveness Index (TTCI, 2007 - 2019):
1. Ticket taxes and airport changes (Hard data - Index of relative cost of access (ticket taxes and airport charges) to international air transport services (0 = highest cost, 100 = lowest cost));
2. Hotel price index (Hard data - Average room rates calculated for first-class branded hotels for calendar year in US$);
3. Purchasing power parity (Hard data - Ratio of purchasing power parity (PPP) conversion factor to official exchange rate);
4. Fuel price levels (Hard data - Retail diesel fuel prices (US cents per liter)).
In many cases, the indicators of the studied countries are slightly different from each other, which indicates high competition among the countries of the region. Therefore, it was necessary to introduce assumptions to conduct in-depth research.
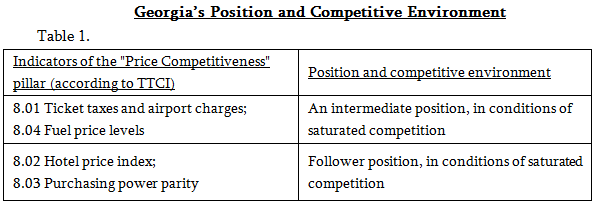
Assumptions, depending on the nature of the data, take into account different approaches. The pillar is calculated by assigning points (from 1 to 7). In this case we applied the following assumption: if the difference between the country with the highest point and the point of Georgia is less than 1.0 or equal to 1.0, we consider that the competition is high; If the difference is greater than 1.0 - the competition is not saturated. In the case of statistical data, we use the coefficient of variation, the use of which in the above-mentioned case (points), due to a small difference in indicators, was not fruitful. In addition, we take into account that we will consider the indicators of the countries of the region and the intensity of competition in relation to Georgia.
For the purpose of our study, we group the data and distinguish the following three positions: leading, intermediate and following.
Using the assumption, it was additionally possible to distinguish those indicators where the competition is saturated or unsaturated.
A statistical test Analysis of Variance (ANOVA) was used to compare the means between different groups. This test helps to determine if there are any significant differences among the means of multiple groups. In simpler terms, it allows us to determine if the values we are comparing are truly different. The IQR methodology was applied to detect each variable's positive or negative interquartile deviations.
For many travelers, a low, competitive price is the primary factor influencing travel decisions (TTCI, 2019). To assess price competitiveness, travelers consider various factors such as airfare, airport charges, fuel costs, and taxes (TTCI, 2019).
International visitors to Georgia in 2022 spent a total of 10.8 billion GEL, with an average expenditure per visit of 2,298 GEL (GNTA, 2022). Expenditure for holiday, recreation, and leisure was 2,905 GEL per visit, while professional and business segments spent 2,725 GEL (GNTA, 2022).
In 2022, 41% of visitors stayed in hotels, and 33% of trips were by air (GNTA, 2022). The total passenger traffic at Georgian airports in 2022 was 4,423,776 (GNTA, 2022). International travel receipts also grew in the post-pandemic period (see chart 2).
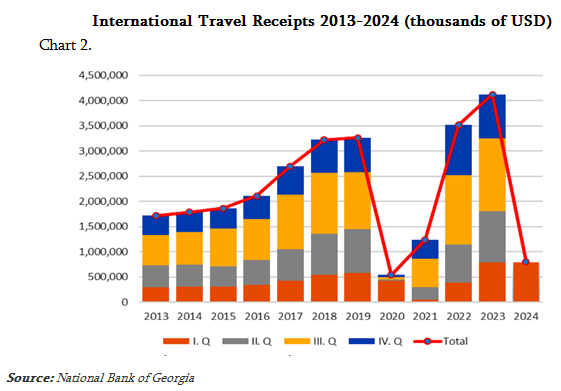
Note: All data is given for the entire year except for 2024. This year’s data is given only for the first quarter
The research design is as follows:
1. Develop a methodology for researching Georgia's competitiveness.
2. Study price competitiveness in the pre-pandemic period.
3. Assess circumstances affecting prices during the pandemic.
Since COVID-19 was declared a pandemic in March 2020 (WHO), pre-pandemic data are up to and including 2019.
The Ranking of Countries in the Study of the Travel and Tourism Competitiveness Index, Price Competitiveness until 2019 is as follows (see Chart 3):
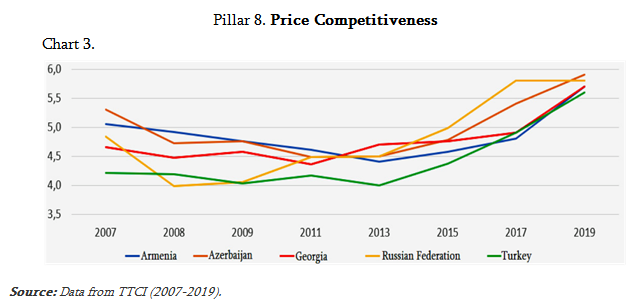
Before 2019, Georgia had a leading position in 2013 but moved to an intermediate position in intense competition. In 2019, Georgia ranked 36th out of 140 countries (5.7 points out of 7). In the region, Georgia does not have a competitive advantage in this pillar, facing intense competition.
Georgia and its neighbors (Txrkiye, Russian Federation, Azerbaijan, and Armenia) are the focus of this research on tourism competitiveness. Since the studied indicators show that the countries in the region react similarly to factors in dynamics, it is appropriate to consider them as competitors. Georgia lacks a competitive advantage in the Price Competitiveness due to intense competition. The country aims to expand high-paying tourist segments, making it challenging to match service quality with prices, and improving service quality could raise prices further.
Using the IQR method, the "Price Competitiveness" pillar showed the outlier only in 2013. Out of the 4 indicators that make up the pillar, only one is characterized by an increasing rate, that is the purchasing power parity (indicator 3), which was increased from 2011 to 2015.
For the first indicator, “Ticket taxes and airport charges,” Georgia’s score has improved since 2015 but remained intermediate until 2020 (see chart 4).
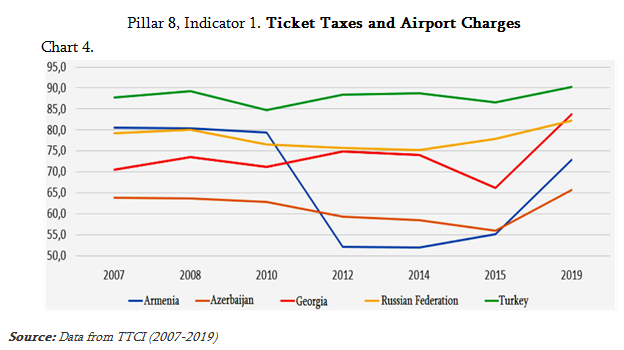
The data is calculated according to International Air Transport Association (IATA) regulations. To address pandemic challenges, IATA postponed fee payments for many countries, including Georgia, Armenia, and Txrkiye, from early 2020 to August 2021 (IATA, 2022). Additionally, Txrkiye reduced its domestic air transportation VAT from 18% to 8% from July to December 2020, lowering ticket and fee payments during the pandemic and easing industry pressure (IATA, 2022). However, Georgia's position likely remained similar to the pre-pandemic situation (IATA, 2022).
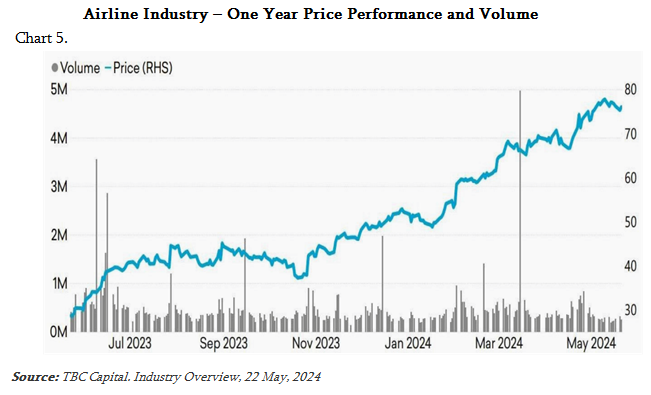
The airline industry is cautiously optimistic following COVID-19 (TBC Capital, 2024). Passenger numbers haven't fully rebounded, but significant developments are shaping the industry's recovery (TBC Capital, 2024). Taxes, fees, and charges remain a large part of ticket prices, which are increasing (TBC Capital, 2024) (see chart 5).
The airline industry, a critical driver of global travel and economic activity, is experiencing a period of cautious optimism following the turbulence of the COVID-19 pandemic (TBC Capital, 2024). While passenger numbers haven't yet fully rebounded to pre pandemic levels, the past few months have witnessed significant developments that are shaping the industry's recovery trajectory (TBC Capital, 2024). However, international travel recovery remains uneven (TBC Capital, 2024). In post pandemic period taxes, fees and charges continue to make up a large portion of the overall ticket price (IATA, 2022). The prices of the tickets are increasing over time (see chart 5).
For the second indicator of the pillar, the “Hotel price index”, Georgia had the highest rate until 2020, indicating high average hotel prices and strong competition. In general, competition in the region is saturated (see chart 6) (Important note: after 2012 there is no data for Armenia):
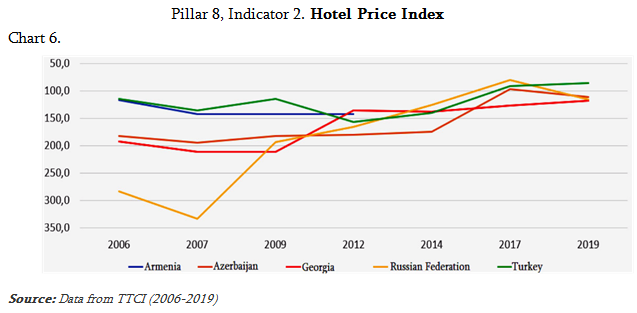
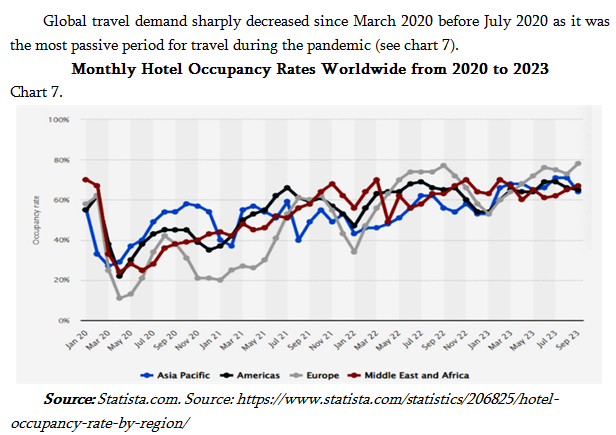
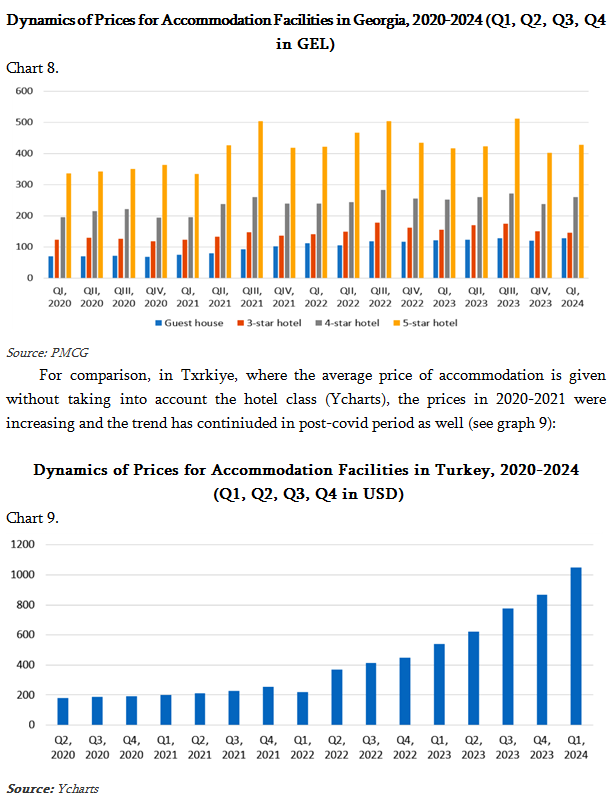
Hotel prices in Georgia during the pandemic were almost unchanged despite low demand most probably because the price was not a competitive tool. Data from 2020 to 2024 shows no significant price fluctuations, with prices growing post-pandemic (PMCG, 2020 - 2024). To compare the prices the data has been collected from 1 quarter of 2020 to 1 quarter of 2024 (see chart 8). The data indicates that there were not significant price fluctuations and in post-COVID period, the prices grew.
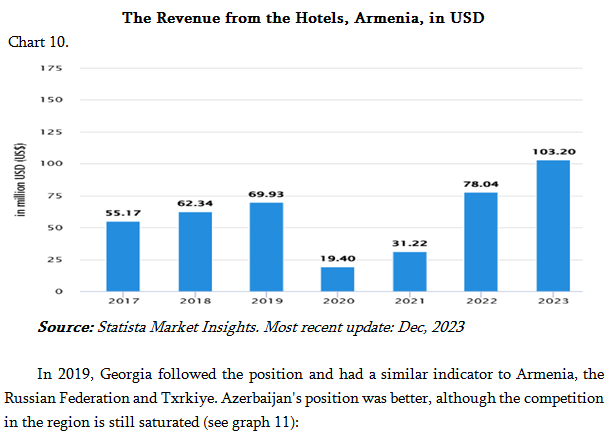
In the case of Armenia, it is possible to compare the average prices of accommodation facilities in 2017 and 2021. In 2017, the average price of three-star hotels ranged from 51 to 69 dollars (Alikhanyan, Danielyan, Hakobyan, Kirakosyan, Harutyunyan, 2017), while the average price for July 2021 is 44 dollars; In 2017, the average price of four-star hotels was from 84 to 108 dollars, (Alikhanyan, Danielyan, Hakobyan, Kirakosyan, Harutyunyan, 2017), and in 2021 - 64 dollars; In the case of five-star hotels, the average price in 2017 was from 131 to 175 dollars (Alikhanyan, Danielyan, Hakobyan, Kirakosyan, Harutyunyan, 2017), and by 2021 it was 122 dollars.
Accordingly, in the case of Armenia, a slight decrease in prices were observed.
As for more recent period we can see that the revenue from the hotels dropped during the pandemic, and from 2022 the hotel market grew rapidly (see chart 10).
Based on the mentioned data, we conclude that in pandemic conditions, hotel prices, despite the decrease in demand, have not changed much. It is likely that during the pandemic in the absence of demand, the price lost its competitiveness and its change could not have a decisive impact on the demand. Even in this case, the positions of the countries under study are not expected to change.
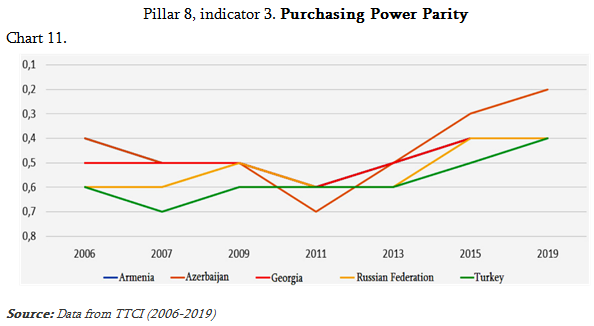
The third indicator of the pillar is “Purchasing power parity”. The World Bank calculates the purchasing power parity ratio in the following way: by comparing the country's currency needed to buy the same goods and services in the domestic market and the US dollar needed to buy the same goods and services in the United States of America (World Bank Group, 2015).
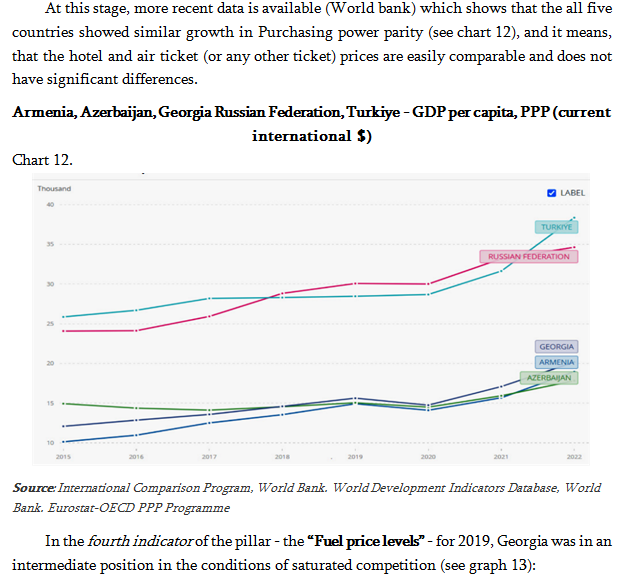
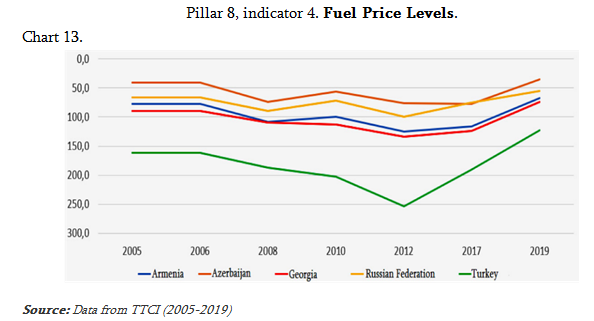
It should be noted that Georgia is almost completely dependent on imported fuel and the country mainly uses imported oil products. Petroleum products obtained as a result of refining crude oil produced in Georgia make up only 2% of the domestic supply (Ministry of Economy and Sustainable Development of Georgia, 2017). This explains why Georgia is the fourth country in the rating among the studied countries. As for Txrkiye, which is fifth, it’s oil product importer (IEA), local oil production meets only 7% of the demand. But Txrkiye as the most expensive gasoline in the world (Biresselioglu, Demir, Ozyorulmaz, 2014) which explains countries position. Armenia is also an oil importer. Its main partners are Georgia, Iran, Russian Federation and Europe (ITA, 2020). Russian Federation is an oil product exporter.
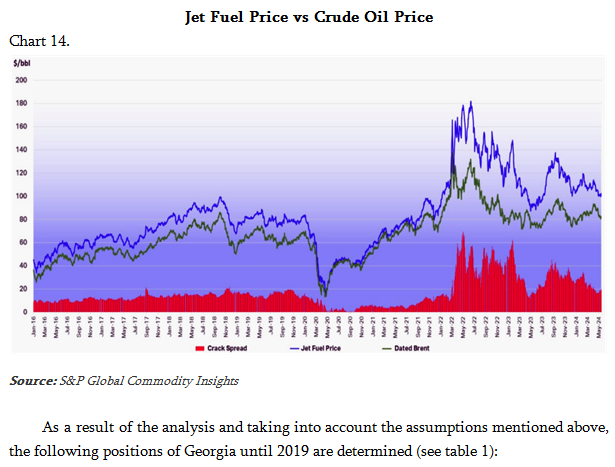
The annual data of Pandimec period reveals, that, in the conditions of the pandemic, after the drop in oil prices in 2020, the prices are increasing (see graph 14):
The changes that the tourism industry has experienced globally are similar in most countries. In the initial stages of the pandemic, the extent of vaccination by country was much more important. Many countries, in order to ensure the safety of travel, including Georgia, required travelers to submit various documents to confirm that travel to their country is allowed (Ministry of Internal Affairs of Georgia, European Parliament). Similar bans have been lifted in most countries. According to data from the World Tourism Organization, international tourism is on the road to recovery and, as of September 2022, has recovered by 57% compared to the pre-pandemic period (UNWTO).
In order for tourism to recover as quickly as possible, for example, the World Travel and Tourism Council has developed many protocols and rules of conduct to make travel as safe as possible (World Travel and Tourism Council).
Results
To summarize the outcomes of the statistical analysis (ANOVA), significant differences were not revealed in the ~Price Competitiveness~ pillar, indicating intense competition among the countries. Using the Interquartile Range (IQR) method, the ~Price Competitiveness~ pillar showed an outlier only in 2013. Out of the four indicators that comprise the pillar, only one, purchasing power parity (indicator 3), exhibited an increasing rate, rising from 2011 to 2015.
Based on the research results, Georgia is facing the following challenges:
• “Hotel price index”: Achieving an intermediate position in conditions of saturated competition.
• “Purchasing power parity”: Maintaining the current position amidst saturated competition.
• “Ticket taxes and airport charges” and “fuel price levels”: Maintaining an intermediate position among competitors in a highly competitive environment.
In the case of the following indicator - "Hotel Price Index" - in our opinion, the main goal, in the long term, should be not so much the reduction of prices, but the improvement of the quality of services provided in hotels.
As a result, in the future, competitiveness should not be expressed in price, but in quality.
In the case of the second indicator - "Purchasing Power Parity" - which is in the following position, Georgia is behind Azerbaijan, but the indicator seems less critical, since the purchasing power parity is approximately the same in the research countries, which loses its decisive importance when making a decision on a trip.
According to the rankings in the Travel and Tourism Competitiveness Index (TTCI), countries with lower purchasing power parity tend to achieve higher rankings. This is because a lower cost of living makes a country more attractive and competitive for visitors. From the point of view of competitiveness of tourism, with purchasing power parity, Azerbaijan has a competitive advantage.
Since the target for the Georgian tourism industry is high-paying tourist segments, the lag of the mentioned indicator should not be considered as a negative event.
As for the indicators in the intermediate position in the conditions of saturated competition, their radical change in the near future is unlikely. Both indicators (Ticket taxes and airport charges; Fuel price levels) are closely related to each other, since a large part of ticket and airport fees comes from fuel. Therefore, in the case of both indicators, maintaining the intermediate position seems important to us.
The proposed methodology can be applied to competing countries in the region included in WEF statistics. Moreover, the same methodology can be used to assess the inter-regional competitive environment.
References:
• Abbas J., Mubeen R., Iorember P. T., Raza S., Mamirkulova G. (2021). Exploring the Impact of COVID-19 on Tourism: Transformational Potential and Implications for a Sustainable Recovery of the Travel and Leisure Industry. Current Research in Behavioral Sciences, Volume 2, November 2021, 100033 https://doi.org/10.1016/j.crbeha.2021.100033
• A World Bank Group, (2015). Global Economic Prospects. https://www.worldbank.org/content/dam/Worldbank/GEP/GEP2015a/pdfs/GEP15a_web_full.pdf
• Airlines, 2024. TBC Capital. https://tbccapital.ge/static/file/202405220844-industry_overview_airlines.pdf
• Alikhanyan A., Danielyan E., Hakobyan D., Kirakosyan M., Harutyunyan T. (2017). 3-Star Hotel in Yerevan. American University of Armenia
• Biresselioglu M. E., Demir M. H., Ozyorulmaz E. (2014). The Rationale Behind Turkey’s High Gasoline Prices. Energy & Environment Volume 25 No. 8 2014
• Dwyer, L., Kim, C., (2003). Destination Competitiveness: Determinants and Indicators. Current Issues in Tourism, 6(5), 369–413
• European Parliament https://www.europarl.europa.eu/portal/en
• Georgian National Tourism Administration https://gnta.ge/
• Gooroochurn, N., & Sugiyarto, G. (2005). Competitiveness Indicators in the Travel and Tourism Industry. Tourism Economics, 11(1), 25-43. https://doi.org/10.5367/0000000053297130
• Govers, R., Go, F.M. (1999). Achieving Service Quality through the Application of Importance-Performance Analysis. in: P. Kunst, J. Lemmink, and B. Strauss (eds.) Service Quality and Management. (pp. 161-185) Focus Dienstleistungs marketing Series (M. Kleinaltenkamp, et al. series-eds.) Wiesbaden: Gabler.
• IEA https://www.iea.org/reports/azerbaijan-energy-profile
• International Trade Administration https://www.trade.gov/country-commercial-guides/georgia-tourism#:~:text=2020%2D10%2D08-,Overview,higher%20than%20the%20previous%20year
• International Trade Administration. https://www.trade.gov/energy-resource-guide-turkey-oil-and-gas
• Khelashvili, I. (2021). Post-Pandemic Expectation of Inbound Tourism in Georgia
• Ministry of Internal Affairs of Georgia https://police.ge/en/home
• Okroshidze, L., Meyer, D. F., & Khelashvili, I. (2024). An Assessment of Tourism Competitiveness: A Comparative Analysis of Georgia and Neighboring Countries. Journal of Eastern European and Central Asian Research (JEECAR), 11(2), 377–393. https://doi.org/10.15549/jeecar.v11i2.1536
• Papava V. (2020). Unconventional Economics: Methodology and Methods. Tbilisi: Ivane Javakhishvili Tbilisi State University Publishing House and Paata Gugushvili Institute of Economics, ISBN 978-9941-13-239-1 (In Georgian)
• PMCG https://www.pmcg-i.com/
• Ritchie J.R.B., Crouch, (2003). The Competitive Destination: A Sustainable Tourism Perspective. Cromwell Press, Trowbridge, UK. ISBN 0-85199-664-7
• Security of Supply - Oil Sector (2017). Ministry of Economy and Sustainable Development of Georgia. https://www.economy.ge/uploads/files/2017/energy/security_of_supply_oil_sector/security_of_supply_oil_sector_eng.pdf
• Škare M., Soriano D. R., Porada-Rochoń M. (2021). Impact of COVID-19 on the Travel and Tourism Industry. Technological Forecasting and Social Change, Volume 163, February 2021, 120469 https://doi.org/10.1016/j.techfore.2020.120469
• Statista, German database company https://www.statista.com/statistics/206825/hotel-occupancy-rate-by-region/
• The Travel & Tourism Competitiveness Report 2019. Travel and Tourism at a Tipping Point. World Economic Forum. https://www3.weforum.org/docs/WEF_TTCR_2019.pdf
• Travel & Tourism Development Index. https://www.weforum.org/publications/travel-tourism-development-index-2024/
• UN Tourism, International Tourism to Reach Pre-Pandemic Levels in 2024. https://www.unwto.org/news/international-tourism-to-reach-pre-pandemic-levels-in-2024
• Understanding the Pandemic’s Impact on the Aviation Value Chain (2022). McKinsey & Company, IATA https://www.iata.org/en/iata-repository/publications/economic-reports/understanding-the-pandemics-impact-on-the-aviation-value-chain
• World Economic Forum https://www.weforum.org/
• World Tourism Organization https://www.unwto.org/
• World Travel and Tourism Council https://wttc.org/Initiatives/Security-Travel-Facilitation
• Ycharts https://ycharts.com/indicators/turkey_consumer_price_index_hotels_and_restaurants
